From: THE SAULT STAR ,
March 13, 1999 Page A1
Sault's welfare rolls swell 60% in 90s: report
Study brands city's quality of life index at 71.1, below 1997 Ontario index of 86.4
By Steven Gallagher
The Sault Star
| The number of people on social assistance in Sault Ste. Marie increased
by more than 60 per cent from 1990 to
1997, says a quality of life index report
released Friday.
The study, conducted by the Algoma
Social Planning Council, indicates that
roughly 5,550 people were on social
assistance in 1997, compared to about
3,450 in 1990.
Overall, the report says Sault Ste.
Marie's quality of life index (based on
12 indicators, including social assistance recipients) dropped nearly 29
points from 1990 to 1997.
The study pegged Sault Ste.
Marie's quality of life index at 71.1,
below the 1997 provincial index of
86.4.
The 12 indicators, ranging from
number of bankruptcies reported to
low birth-weight babies, generated in-
formation about the social, economic,
health and environmental situation in
the city.
The project's aim is to tell how the city's quality of life measures up over a period of years (1990-97), and how it stacks up against the rest of Ontario. Sault Ste. Marie is the first Northern Ontario community to release its index report. The council, which received sup- port from the United Way, Human Resources Development Canada and the city to carry out the study, is expected to complete its 1998 quality of life index report in the next two months. While some indicators reflect a promising picture of the city (number of low birth-weight babies, number of effluent discharge spills and long-term care waiting lists) others are viewed as a cause for concern, including the number of people in the labour force unemployed and hours of poor air quality. Gayle Broad, chair of the planning council's research committee, said the report is useful because it highlights areas where action needs to be taken. "To understand the real well-being of the community, you need to look at an integrated collection of data," she said of the health, social, economic and environmental indicators. "In the past, often our emphasis has been in one area or in another area. This brings them all together." Broad emphasized that the indicators do not provide a complete overview of the quality of life in the city, but are a "snapshot." She said the study, which is being conducted by more than 30 communities across the province, should not be seen as doom and gloom for the Sault. "We were in quite a good place in 1990. If you look at where we were, that was prior to Algoma Steel down- sizing and so on," she said, "If you compare ourselves to where we were in 1990, in fact we might be still doing quite alright. I don't want people to sort of go, 'Well, there's no hope for us. The report has been forwarded to lo- cal politicians and will be used by the Building an Extraordinary Community strategic planning committee. Mayor Steve Butland also referred to the report as a snapshot, adding "There could be a whole lot of other indicators." Butland noted that the Sault's crime statistics are "way down" and that the cost of living is "probably just excellent. "You could use those (indicators) to say well we probably rate As in those areas," said the mayor. "Not to discard at all what they (the council) are telling us. I accept the information as valid. We got a few As and several Fs. The key is what you do with this information." Butland said social ills, such as the number of individuals receiving social assistance, are usually an indication of economic ills. If a city improves its economic situation, he said many of its social problems decrease. Here's a breakdown of the report:Social indicatorsThe number of children in the care of the Children's Aid Society increased by more than 60 per cent from 1991 to 1997. (About 220 in 1997 and 140 in 1991.) "Leaders in this area in Sault Ste. Marie indicate that children tend to stay in care longer in Sault Ste. Marie than elsewhere because of a lack of support services which would allow a return to their families sooner," said the report. The number of people on social housing waiting lists increased by about 24 per cent from 1992 to 1997 - 360 to 444.Economic indicatorsThe number of people in the labour force working in 1997 was 35,100, compared to 35,900 in 1990. In 1990, about 3,600 people in the labour force were out of work, com- pared to 5,000 in 1997. The report suggests that the Sault needs more medium-sized employers. It points out that ASI employs approximately 5,000 people, while the next largest employers provide work for a few hundred or less. "There is no industry that provides employment for a workforce between these two extremes," says the report. The number of bankruptcies reported in Sault Ste. Marie rose from 163 cases in 1990 to 293 in 1997.Health IndicatorsBroad said the percentage in- crease in the number of suicides is misleading, given the small number of suicides reported. The number of suicides in Sault Ste. Marie in- creased by about 70 per cent from 1990 to 1997. According to the re- port, six suicides were reported in 1990, compared to 10 in 1997. She said suicides won't be used an indicator in the future. "It's too small of a number on a province-wide basis," Broad said. "There's also a delay in reporting suicide deaths because of the investigation that has to be done." Long-term care waiting lists decreased from 209 to 176 from 1995 to 1997. The number of low birth-weight babies was relatively unchanged from 1991 to 1997.Environmental IndicatorsOne of the biggest areas of concern for the council was that hours of poor air quality increased dramatically from 1990 to 1997. Further study of this indicator will be required, the study says. According to the report, there were 222 hours of poor air quality in 1990, compared to 301 in 1997. The measurement explains how many hours the number of pollutants in the air exceed a certain level, Broad said. On the other hand, effluent discharge spills decreased from 237 in 1990 to 106 in 1997. Tonnes diverted to blue boxes decreased by about 21 per cent from 1991 to 1997. "It is quite possible that the decline may have been initiated by a withdrawl of subsidies to the program," the report says. "It is also possible that a withdrawal of funding by the City of Sault Ste. Marie for a public education program may have compromised the success of this initiative."Gary Mauracher, acting director of HRDC in Sault Ste. Marie, said the report: will be a valuable tool for making decisions in the future. "As a community, it's important that we have this type of information available to us and that we capture the relevant information so that when we are making decisions, we are making decisions based on good solid data," he said. Mauracher said it's critical the community identify other indicators, which can be reported on a regular basis. "When you look at this report, specifically, it's very important that you realize that this is simply presenting Sault Ste. Marie's relative position against 12 indicators. Nothing more and nothing less," he said. "Now, they are important indicators, but it doesn't necessarily mean that's how I define quality of life to be in Sault Ste. Marie. "Let's talk about identifying the other variables that we can start to capture and report on." The Algoma Social Planning Council says there were limitations in both the data collecting and the calculation of the index numbers in the quality of life study. They include:
The report is available to the public by calling the council at 253-3246
|
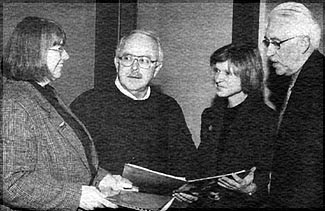 MAYOR STEVE BUTLAND (right) receives the quality of life preliminary report from Gayle Broad (left), Algoma Social Planning Council research chair, Mike McFarling, Algoma Social Planning Council and Eileen Forestell, strategic planning co-ordinator for Building an Extraordinary Community. |